Unstructured Data
>>>>>>>>>>>
Intelligent Health Outcomes
Powered by Circlebase NLP platform

Data Visualization

THE CHALLENGE​

Today’s healthcare systems collect and track an ocean of information round the clock. Be it EHRs/EMRs, disease registers, clinical repositories, Labs, remote monitoring devices, IoT interfaces, hospital management systems, Clinical Trial Management Systems. The key challenges include

  • Siloed data: Multiple locations and public datasets
  • Structured and Unstructured data
  • Multiple tools: Point products for data integration
  • Cumbersome Data pipelines: For ingestion and data transformation
  • Data Governance and compliance
  • Limited infrastructure: Not scalable and economical

Unifying diverse medical data from various sources and transforming it into intelligent health outcomes that are easy to interpret visually remains a key challenge. The primary purpose of data visualization is to help the user interpret data analytics results faster, recognize trends, and make informed decisions.

Circlebase’s Data Visualization Solution

Our data visualization solution is powered by AI/ML and deep learning technologies. It helps identify patterns, correlations, and makes data analysis more relevant. It includes interactive infographic dashboards, bar charts, pie charts, heat maps, and histograms, for a visual representation of intelligent health outcomes.
Our solution treats your data woes with tableau treatment.

Please find below a few visualization snapshots of our solution:

Patient Cohort Builder

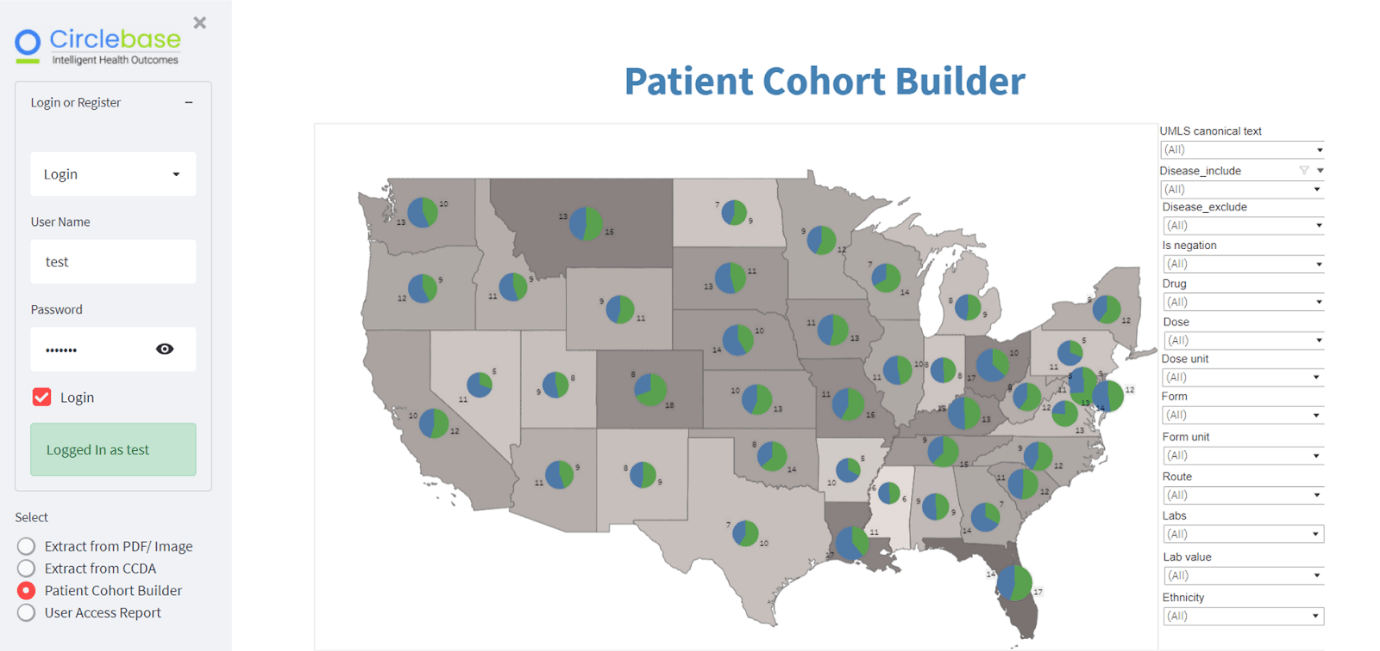
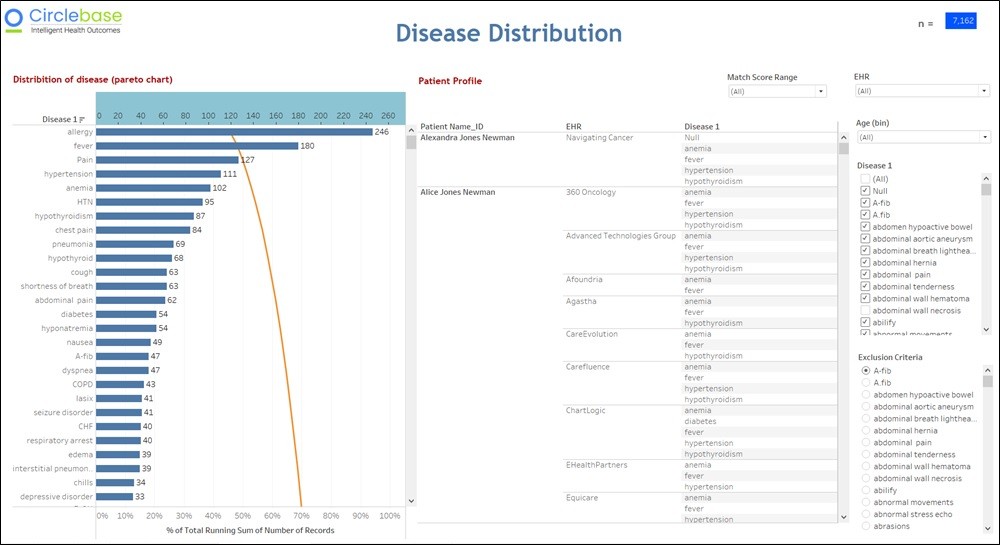
The entity extraction app identifies a wide range of clinical, social, and demographic entities from the data, which could then be used to identify the suitable patient cohorts for recruitment drives.

Data Visualization

Data Visualization
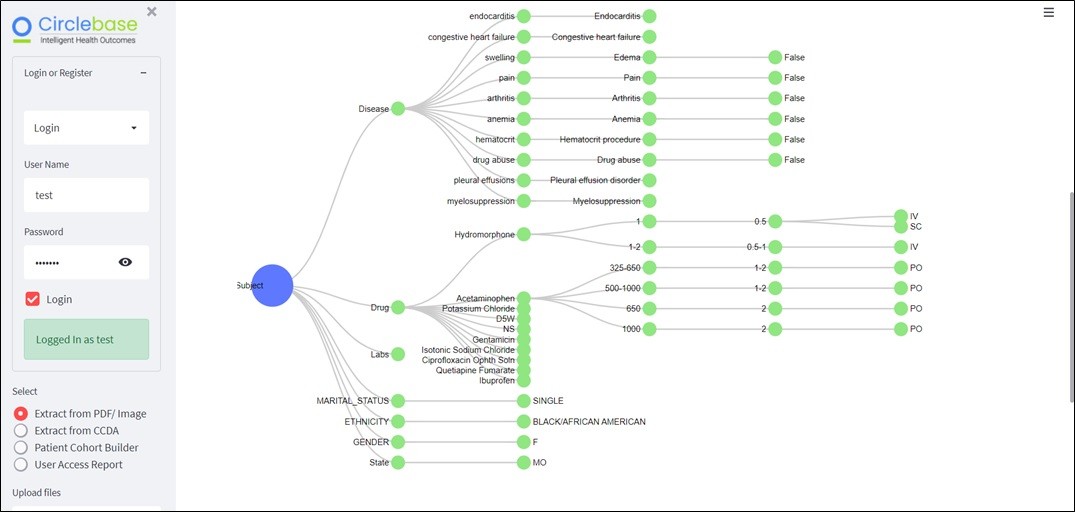
Extracted patient data represented in an intuitive and interactive graph

Salient Features

  • SaaS application: Hosted on HIPAA compliant cloud platform 
  • NLP platform powered
  • Harmonizes: Structured, unstructured, and hidden data for analysis 
  • Integration: With the current AI/ML model
  • API driven: Integrate with healthcare platforms, ERPs
  • Normalized data: For different ontologies and correct interpretation
  • Interactive, self-service, and motion graphics

How can we help? - Our Value Matrix

Our solution can perform the necessary steps to provide you with intelligent insights by integrating with several of the enterprise healthcare applications that provide multiple formats of healthcare data. Please find below select samples of how our solution helps you

Providers

  • Clinical decision support
  • Precision medicine
  • Detecting errors/Fraud
  • Patient/drug profiling
  • Patient cohort Analysis
  • Care coordination

Payers

  • Risk scoring for chronic diseases, population health
  • HEDIS reporting
  • Provider profiling (Performance metrics)
  • Patient profiling (health metrics)

Life sciences & CRO

  • Patient Match score & criteria
  • Cohort analysis
  • Overall Clinical Trial progress
  • Gene-Phenotype relationship
  • Analyze the efficacy of Trials
  • Streamline compliance
  • Risk Based monitoring
  • Faster analysis of adverse events

Pharma & MedTech Companies

  • Streamline compliance
  • Competitor analysis
  • RWE analysis
  • Interactive dashboard – Doctors
  • Drug performance

Connect
with Us

Fill out this form and we’ll connect with you to discuss how we can help you.

By submitting I confirm that I have read and agree to the Privacy Policy